
How Much Electricity Will Solar Panels Generate in the UK?
A typical UK solar panel system can generate roughly 750–1,000 kilowatt-hours (kWh) of electricity per year for every kilowatt peak (kWp) installed. A well-positioned 4kWp system may therefore produce around 3,000–4,000kWh annually, although location, roof direction, pitch, shading and system design can change the result significantly. This is a broad planning range synthesised from UK output estimates and the site-specific methodology used by MCS and PVGIS; an accurate forecast requires details about the property.
This guide explains how to estimate solar output, what generation looks like through the seasons, how much electricity your home may use, and why a property-specific survey matters. It is for homeowners, landlords, renovators and EV owners who want realistic figures rather than a best-case headline.
Get Your Solar Panel Quote
Start with your address so we can check the best solar options for your home.
Quick answer
Multiply the solar array size in kWp by the expected local yield in kWh per kWp, then adjust for shading. As an early estimate, a 3kWp system may generate 2,250–3,000kWh a year; a 4kWp system 3,000–4,000kWh; and a 5kWp system 3,750–5,000kWh. South-facing, lightly shaded roofs usually sit towards the upper end. East- or west-facing roofs can still perform well, especially when their wider generation window matches household demand. Panels continue producing in winter, but most annual generation arrives between spring and early autumn.
Table of Contents
ToggleHow much electricity do solar panels generate in the UK?
These are useful planning ranges for an unshaded or lightly shaded roof with a reasonable orientation. They do not replace an MCS performance estimate.
| Solar array size | Approximate 400W panels | Indicative annual generation | Daily annualised average |
|---|---|---|---|
| 2kWp | 5 | 1,500–2,000kWh | 4.1–5.5kWh |
| 3kWp | 8 | 2,250–3,000kWh | 6.2–8.2kWh |
| 4kWp | 10 | 3,000–4,000kWh | 8.2–11.0kWh |
| 5kWp | 13 | 3,750–5,000kWh | 10.3–13.7kWh |
| 6kWp | 15 | 4,500–6,000kWh | 12.3–16.4kWh |
Do not treat the daily average as a promise. A bright June day can produce many times more electricity than a dark December day. Output also varies by year and region. Energy Saving Trust modelled a 4.5kWp system on a partially shaded, south-west-facing roof in north-west England at 2,850kWh a year—below what the same array might produce on an unshaded southern roof.
What do kWp and kWh mean?
kWp, or kilowatt peak, is the rated maximum power of the array under standard test conditions. Ten 400W panels create a 4kWp array.
kWh, or kilowatt-hour, measures electricity produced or consumed over time. Running a 1kW appliance for one hour uses 1kWh.
A 4kWp system does not continuously produce 4kW. Output rises and falls with daylight, cloud, roof conditions and shade. What matters for bills is annual kWh, how much you use directly, and how much you store or export.
How to calculate likely solar output
MCS uses a site-based method:
Estimated annual output = array size in kWp × location-and-roof yield × shading factor
The calculation considers postcode region, array pitch, orientation and shading. MCS also warns that solar radiation changes by location and year, so estimates are guidance rather than guarantees.
Example:
- Array size: 4kWp
- Adjusted local yield: 900kWh per kWp
- Shading factor: 0.95
- Estimated generation: 4 × 900 × 0.95 = 3,420kWh a year
A professional quote should show these assumptions. Be cautious when a proposal gives only panel wattage or a precise savings claim without explaining orientation, shade and household use.
What affects solar generation?
MCS identifies inclination, orientation and shading as the main site factors. Equipment and design then determine how efficiently available sunlight becomes usable electricity.
| Factor | Likely effect | What the installer should check |
|---|---|---|
| Location | Southern areas generally receive more solar radiation | Postcode-specific yield |
| Roof direction | South often maximises annual output; east/west spreads it across the day | Each roof face modelled separately |
| Roof pitch | Changes how directly sunlight reaches the panels | Measured pitch |
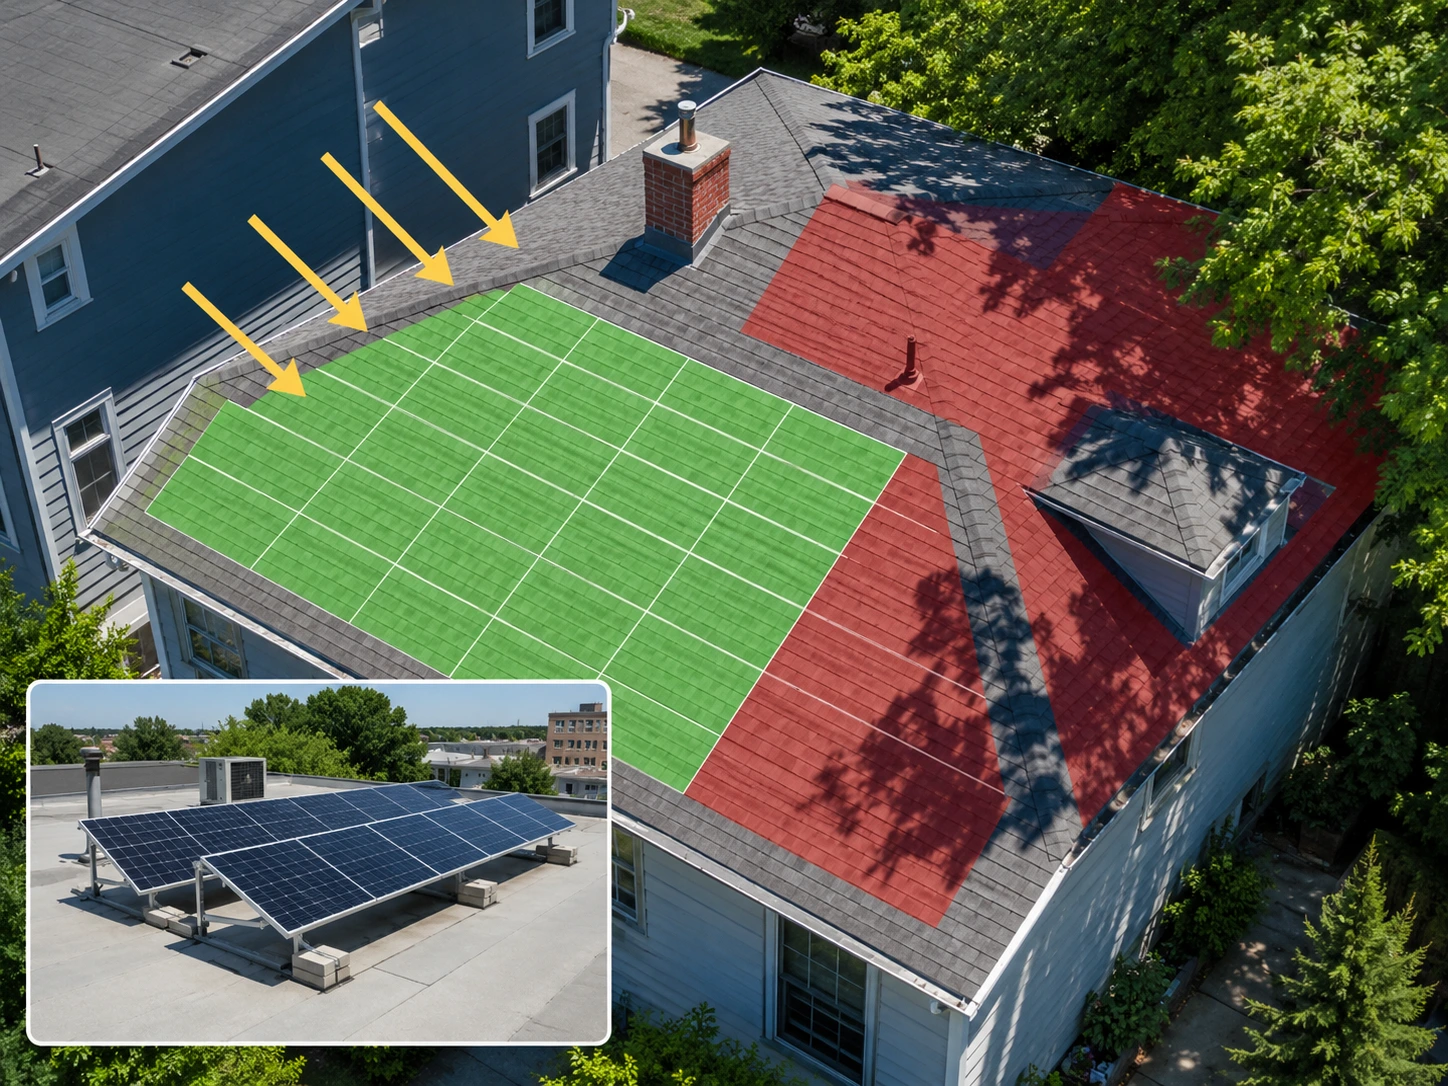
| Shading | Trees, chimneys, dormers and buildings reduce output | Site-specific shade analysis |
| Array size | More kWp normally means more annual kWh | Roof area and grid limits |
| Inverter design | Poor matching can constrain output | Inverter size and string layout |
| Condition | Dirt, faults and degradation can reduce yield | Monitoring and warranties |
Higher-efficiency panels are most valuable where roof space is limited. They do not compensate for poor placement or design.
Do solar panels work in winter?
Yes. Solar PV uses daylight, not heat, so panels generate on cold and overcast days. Winter output is lower because days are shorter, the sun is lower and shading can become more pronounced. National Grid confirms that solar technology remains effective during winter, while UK owners commonly report a large gap between summer and winter generation.
The practical question is not whether solar works in December, but what it produces over a full year. Expect to import more grid electricity in winter and export more during bright spring and summer periods.
A battery does not create additional energy; it shifts generation to another time. In winter, a large battery may not fill from solar alone. In summer, it may fill early, leaving surplus for water heating, EV charging or export.
How much solar electricity will your home use?
Generation and savings are different. Solar normally supplies the home first. Surplus can charge a battery or EV, heat water, or go to the grid.
Direct use is usually higher when somebody is home during daylight, appliances run around midday, or the property has steady daytime demand. In Energy Saving Trust’s north-west example, the household was expected to use 35% of generation and export 65%.
A battery can increase self-consumption by storing daytime surplus for evening use. Export also has value: the Smart Export Guarantee requires licensed suppliers to offer tariffs for eligible small-scale low-carbon electricity exported to the grid, although customers must apply and terms vary.
How to choose the right solar system
- Use real consumption data. Review 12 months of bills or smart-meter readings.
- Include future demand. Mention any planned EV, heat pump, extension or home office.
- Measure the roof. Check area, pitch, direction, structure and shade.
- Compare annual generation. Panel count alone does not show expected output.
- Check usage assumptions. High generation does not guarantee high savings if most energy is exported.
- Demand a clear estimate. It should state kWp, annual kWh, shading, roof faces, inverter capacity and export limits.
- Compare long-term protection. Review product warranties, workmanship cover, monitoring and aftercare.
Families and home workers may benefit from scheduling appliances during daylight. EV owners should compare daytime solar charging with low-cost overnight tariffs. Landlords may prioritise simple monitoring and strong warranties. Businesses with daytime demand can often use more generation directly.
Example UK use case
Consider a family with a 4kWp south-west-facing array, moderate afternoon demand and no major shade. If its survey predicts about 3,400kWh annually, the family might use washing, dishwashing and EV charging during solar hours, store some surplus for the evening, and export the remainder.
The system will not remove grid imports throughout winter, but it can materially reduce daytime purchases over the year. This is why generation, consumption timing and export value should be modelled together rather than judged from panel capacity alone.
Costs, savings and payback
Energy Saving Trust currently describes a typical domestic system as around 4.5kWp and approximately £7,600, with cost affected by system size, roof access, mounting and roof condition. Its July 2026 examples show payback periods of roughly 9–12 years across selected UK locations when export payments are included.
These are benchmarks, not quotations. Returns depend on generation, electricity prices, export rates, self-consumption, maintenance, finance and battery cost. Compare expected annual kWh, total installed cost, cost per kWp, self-use assumptions, export income, warranties and payback. A survey is required for an accurate quotation.
Why the installer matters
Poor placement can create avoidable shade. Weak string design can allow one shaded area to restrict more of the array. Unsuitable inverters or cable design can waste energy, while poor roof work creates safety and weatherproofing risks.
An MCS-certified installer should provide a documented performance estimate, use compliant products and explain forecast limitations. MCS standards are intended to provide a quality benchmark for small-scale renewable energy design and installation.
The best design is not automatically the highest headline kWp; it is the design that safely turns the available roof area into useful electricity and matches the property’s needs.
Frequently asked questions (FAQs)
Clear answers about solar-panel electricity generation, daily and annual output, cloudy weather, winter performance, roof direction, shading and battery storage. Speak to Simple Green Energy .
Want to estimate your solar output?
Speak with Simple Green Energy about system size, roof direction, shading, seasonal generation, battery storage and the expected electricity output for your property.
Estimate my solar generationExpert recommendation and conclusion
For most suitable UK homes, compare the largest sensible roof array with a demand-matched option. A larger design may offer better value per panel and support a future EV or heat pump, provided the roof, inverter and export arrangements suit it.
A typical UK array may produce around 750–1,000kWh per installed kWp each year, making 3,000–4,000kWh a reasonable first estimate for a well-sited 4kWp system. The reliable next step is a professional survey with a transparent calculation.
Book a free home survey with Simple Green Energy for a property-specific estimate of annual generation, seasonal output, savings and battery options.