
Solar Panel Output Per Month UK: What Can You Really Expect?
A typical 4kWp solar panel system in the UK may generate roughly 3,000–4,000kWh of electricity a year, but the output is not spread evenly across 12 months. A suitable system can produce several times more electricity in a bright summer month than in December. That seasonal difference matters when sizing panels, comparing batteries and estimating bill savings.
This guide explains realistic solar panel output per month in the UK using a 4kWp system as a practical benchmark. It covers winter and summer performance, location, roof direction, shading, system sizing, costs, payback and how to judge an installer’s forecast.
The figures are planning estimates, not guarantees. MCS states that solar performance cannot be predicted with certainty because sunlight varies by location and from year to year.
Get a free solar assessment: Simple Green Energy can estimate your likely annual and monthly generation using your postcode, roof layout, orientation, shading and electricity consumption.
Get Your Solar Panel Quote
Start with your address so we can check the best solar options for your home.
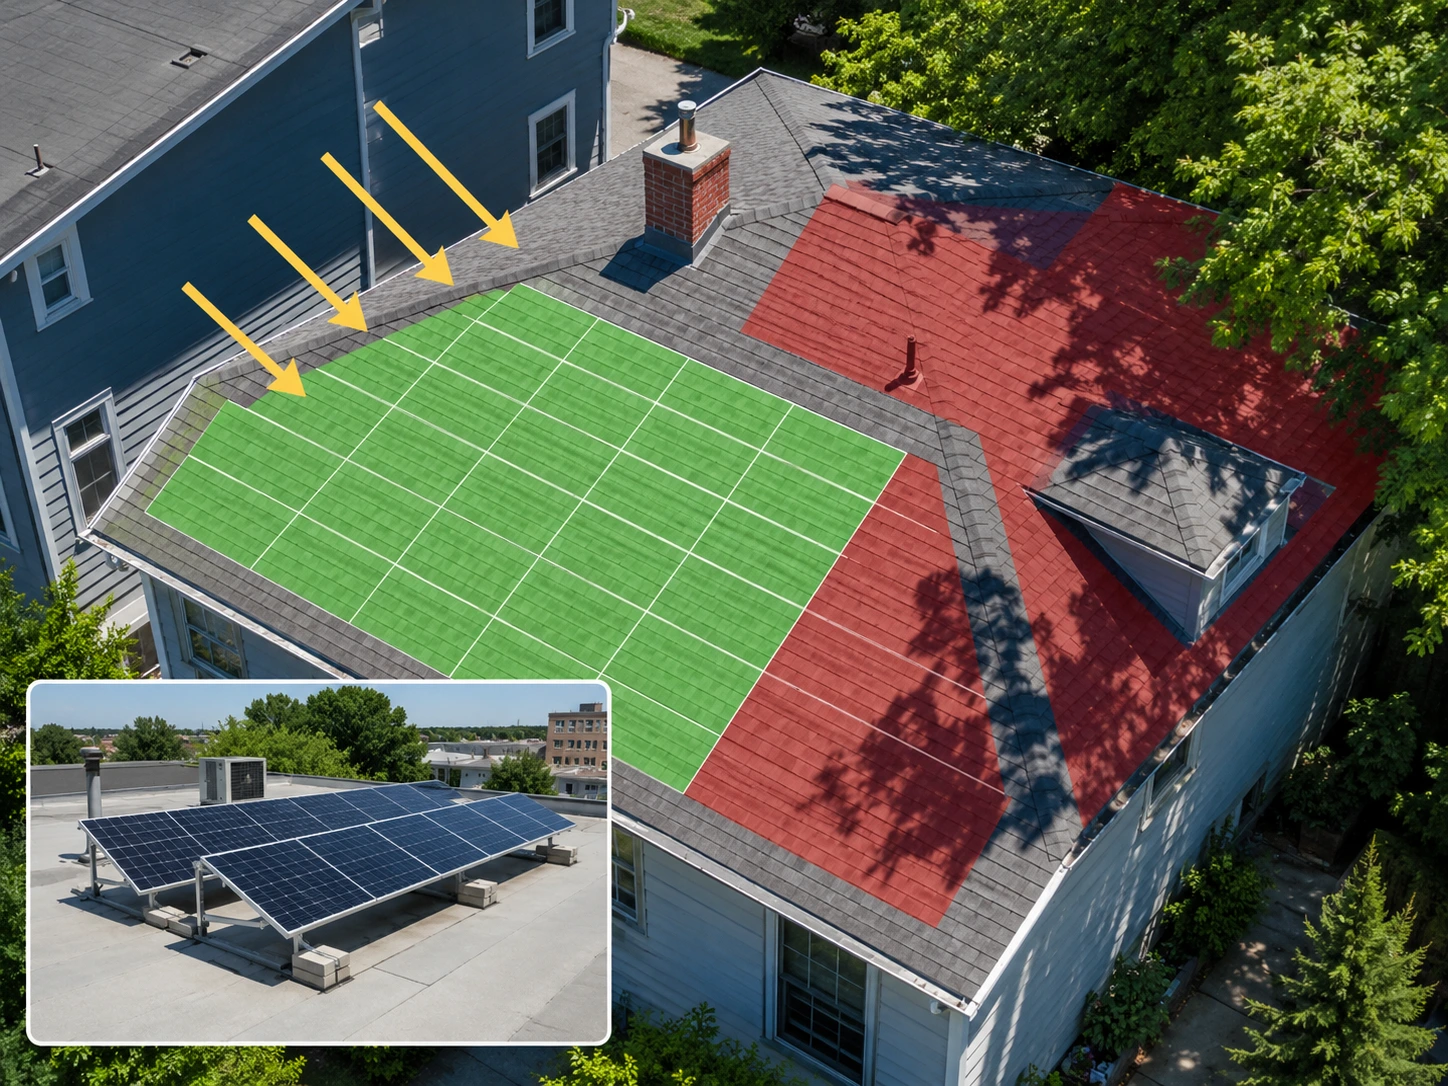
Quick answer: how much electricity do solar panels produce per month in the UK?
For a typical 4kWp UK solar system, the simple 12-month average may be around 280–300kWh per month. In reality, a south-facing, lightly shaded system might generate approximately 400–500kWh in a strong late-spring or summer month, but only around 40–150kWh in winter. Solar panels still work in cloudy weather because they use daylight rather than heat, although shorter days and lower light levels reduce output. Roof direction, pitch, shading, location, panel capacity and system losses all affect the final result.
Table of Contents
ToggleEstimated solar panel output per month in the UK
The figures below illustrate a 4kWp, south-facing, unshaded system with a suitable roof pitch and annual generation of approximately 3,400kWh.
They are not a substitute for a site-specific MCS performance estimate. Published UK examples commonly place summer output from a 4kW system at around 14–18kWh per day, with winter output falling to approximately 1–5kWh per day.
| Month | Estimated output | Average per day | Typical pattern |
|---|---|---|---|
| January | 90kWh | 2.9kWh | Short days and low sun |
| February | 150kWh | 5.4kWh | Output begins improving |
| March | 300kWh | 9.7kWh | Strong spring increase |
| April | 390kWh | 13.0kWh | Good daytime generation |
| May | 470kWh | 15.2kWh | Often an excellent month |
| June | 500kWh | 16.7kWh | Longest daylight hours |
| July | 480kWh | 15.5kWh | High but weather-dependent |
| August | 410kWh | 13.2kWh | Still strong |
| September | 300kWh | 10.0kWh | Useful autumn output |
| October | 180kWh | 5.8kWh | Rapid seasonal decline |
| November | 90kWh | 3.0kWh | Limited surplus generation |
| December | 40kWh | 1.3kWh | Usually the weakest month |
Real installations can vary significantly. UK system owners frequently report very low output during dull winter periods and much higher summer peaks, which is why annual generation should never be interpreted as 12 equal monthly amounts.
Suggested visual: a monthly bar chart highlighting May to August as the main generation season.
Why does solar panel output change through the year?
UK summer days are longer and the sun sits higher in the sky. Solar panels therefore receive stronger light for more hours.
During winter:
- Daylight hours are shorter.
- The sun remains lower in the sky.
- Cloud cover can be more persistent.
- Nearby buildings and trees may cast longer shadows.
- Household electricity demand is often higher.
Temperature matters less than many homeowners assume. Solar panels need light rather than hot weather and can perform well on cool, bright days. They also generate electricity in overcast conditions, but usually at a lower level because less light reaches the solar cells.
Persistent shade from chimneys, trees, dormers or nearby properties can be more damaging than occasional bad weather because it may reduce generation during the same hours every day.
What affects monthly solar generation?
Location
Southern parts of the UK generally receive more solar radiation than northern areas. Two identical systems in southern England and Scotland will not normally produce exactly the same annual total.
Energy Saving Trust’s current calculations also demonstrate the effect of location on financial returns, with longer example payback periods in Stirling than in London.
Suggested visual: a UK map showing typical regional solar-yield differences.
Roof direction and pitch
An unshaded south-facing roof is normally best for maximising total annual generation.
East- and west-facing roofs can still be worthwhile. They may provide useful morning and late-afternoon production, particularly where household demand is spread across the day. However, Energy Saving Trust estimates that east- or west-facing systems tend to produce around 15–20% less electricity than directly south-facing systems.
A moderately pitched roof will generally provide a better year-round result than panels installed completely flat. Flat-roof panels can normally be mounted on angled frames, subject to structural and wind-loading requirements.
Shading and system design
A professional survey should identify nearby obstructions and explain whether equipment such as panel optimisers is justified.
MCS requires performance calculations to include a shade factor when shading is present. Panel layout, inverter sizing, cable losses, ventilation and commissioning can also affect the amount of usable electricity delivered to the property.
How to estimate your own solar panel output
The standard MCS annual calculation considers installed capacity, location-specific yield and shading:
Estimated annual output = system size in kWp × local yield × shade factor
MCS location tables use solar data supplied by the European Commission’s Joint Research Centre. Installers must provide customers with the assumptions behind their generation estimate.
Use this six-step sense-check:
- Confirm the proposed system size in kWp.
- Ask for estimated annual generation in kWh.
- Check the assumed roof orientation and pitch.
- Review the installer’s shading calculation.
- Request a month-by-month generation profile.
- Compare the forecast with an independent calculator.
PVGIS is a free European Commission tool that estimates average monthly and annual solar production for a chosen location and system configuration. Energy Saving Trust also provides a UK solar calculator covering likely system size, generation, cost and savings.
Treat forecasts that are substantially higher than independent estimates with caution.
Solar panel costs, output and buyer suitability
Energy Saving Trust currently puts a typical 4.5kWp domestic solar installation at approximately £7,600. Battery storage commonly adds around £5,000–£8,000.
Your quotation will depend on roof access, scaffolding, electrical upgrades, panel choice, mounting equipment and whether roof repairs are required.
| Buyer or system | Main consideration | Likely benefit | Best fit |
|---|---|---|---|
| 2–3kWp array | Lower roof area and upfront cost | Lower overall generation | Smaller homes |
| 4–4.5kWp array | Mainstream domestic size | Around 3,000–4,000kWh yearly in suitable conditions | Many family homes |
| 5–6kWp array | More roof space and possible network checks | Greater summer surplus | EV or heat-pump households |
| Solar plus battery | Higher initial investment | More solar used after sunset | Evening-heavy electricity users |
| East–west array | Wider generation window | Morning and afternoon production | Properties with split roofs |
An on-site or detailed remote survey is required for accurate costs and generation figures.
Suggested visual: a decision flowchart matching household electricity use to system size.
Will solar panels save money?
Solar savings come from:
- Using generated electricity in your property.
- Exporting unused electricity to the grid.
- Avoiding higher-cost electricity periods with battery storage.
- Charging an EV or running appliances during solar hours.
The Smart Export Guarantee allows eligible small-scale generators to receive payment for metered electricity exported to the grid. Export rates and contract conditions vary between suppliers.
Electricity used directly in your home is often more valuable than exported electricity because it replaces energy you would otherwise buy. Energy Saving Trust currently uses around 12p/kWh as a typical export assumption and notes that imported electricity generally costs considerably more.
Its July 2026 examples indicate estimated solar payback periods of approximately 9–12 years, depending on location and occupancy.
The strongest returns normally come from a suitable roof, competitive installation price and a household that can use meaningful amounts of electricity during daylight hours.
Do solar panels work in winter?
Yes, but output is considerably lower.
A 4kWp system may produce only a few kilowatt-hours on a dull winter day and will normally continue importing grid electricity, particularly for evening demand, electric heating and EV charging.
Solar should therefore be presented as an annual electricity generator rather than a promise of winter self-sufficiency. Real-world UK owners report winter days producing less than 1kWh in poor conditions, with substantially higher output on clear days.
A battery can move daytime generation into the evening, but it cannot move summer electricity into winter. During December and January, there may not be enough surplus solar generation to charge a large battery fully.
How to choose the right solar system
- Review your electricity use. Examine at least 12 months of bills and include any planned EV, heat pump or extension.
- Assess the complete roof. Compare south-facing and east-west layouts rather than focusing only on panel count.
- Demand a shading assessment. Ask what causes every quoted generation loss.
- Compare warranties separately. Review the panel product warranty, performance warranty, inverter cover and installation workmanship guarantee.
- Consider future battery compatibility. A battery-ready inverter may be valuable, but only where the design and costs support it.
- Compare lifetime value. Look at generation, equipment quality, monitoring, aftercare and likely replacement costs—not simply the cheapest quotation.
- Check the installer. Energy Saving Trust recommends obtaining at least three quotations and using MCS-certified installers.
Why the installer matters
Installation quality affects safety, weatherproofing, electricity output and long-term reliability.
Poor panel placement can create avoidable shading. An unsuitable inverter can restrict generation. Weak cable design can introduce unnecessary losses, while poor roof work can cause expensive defects.
The current MCS solar standard requires competent design and installation, pre-sale performance calculations, system documentation, commissioning and customer handover. It also makes clear that performance forecasts are estimates rather than guarantees.
Ask every installer to provide:
- The proposed panel layout.
- Monthly and annual generation estimates.
- The shade calculation.
- Panel and inverter specifications.
- Monitoring access.
- Warranty and workmanship terms.
- Grid connection arrangements.
- Aftercare and fault-reporting procedures.
Suggested visual: a labelled installation photograph showing the panels, inverter, isolators, meter and optional battery.
Frequently asked questions (FAQs)
Clear answers about monthly solar output, seasonal variation, cloudy-day generation, roof direction, night-time electricity use and battery storage. Speak to Simple Green Energy .
Want a monthly solar-generation forecast?
Speak with Simple Green Energy about system size, roof direction, expected seasonal output, battery storage and the monthly generation profile for your property.
Estimate my monthly outputConclusion:
For a typical 4kWp UK solar system, a realistic planning range is approximately 3,000–4,000kWh per year, with perhaps 400–500kWh in a strong summer month and only 40–150kWh during a winter month.
The exact result depends on your postcode, roof direction, pitch, shading, system design and weather.
The right solar system is not necessarily the one with the biggest headline output. It is the system with a transparent, site-specific forecast that matches your household’s electricity consumption.
Book a free home solar survey with Simple Green Energy for a tailored generation estimate, roof assessment and savings projection.